Data Visualizations

Annual Website Data for Economic Development Retail
The City of College Station is constantly working with new retailers to enter into the growing market. With this data visualization, retails can see the economic metrics and benefits all in one place.

Economic Development Master Plan
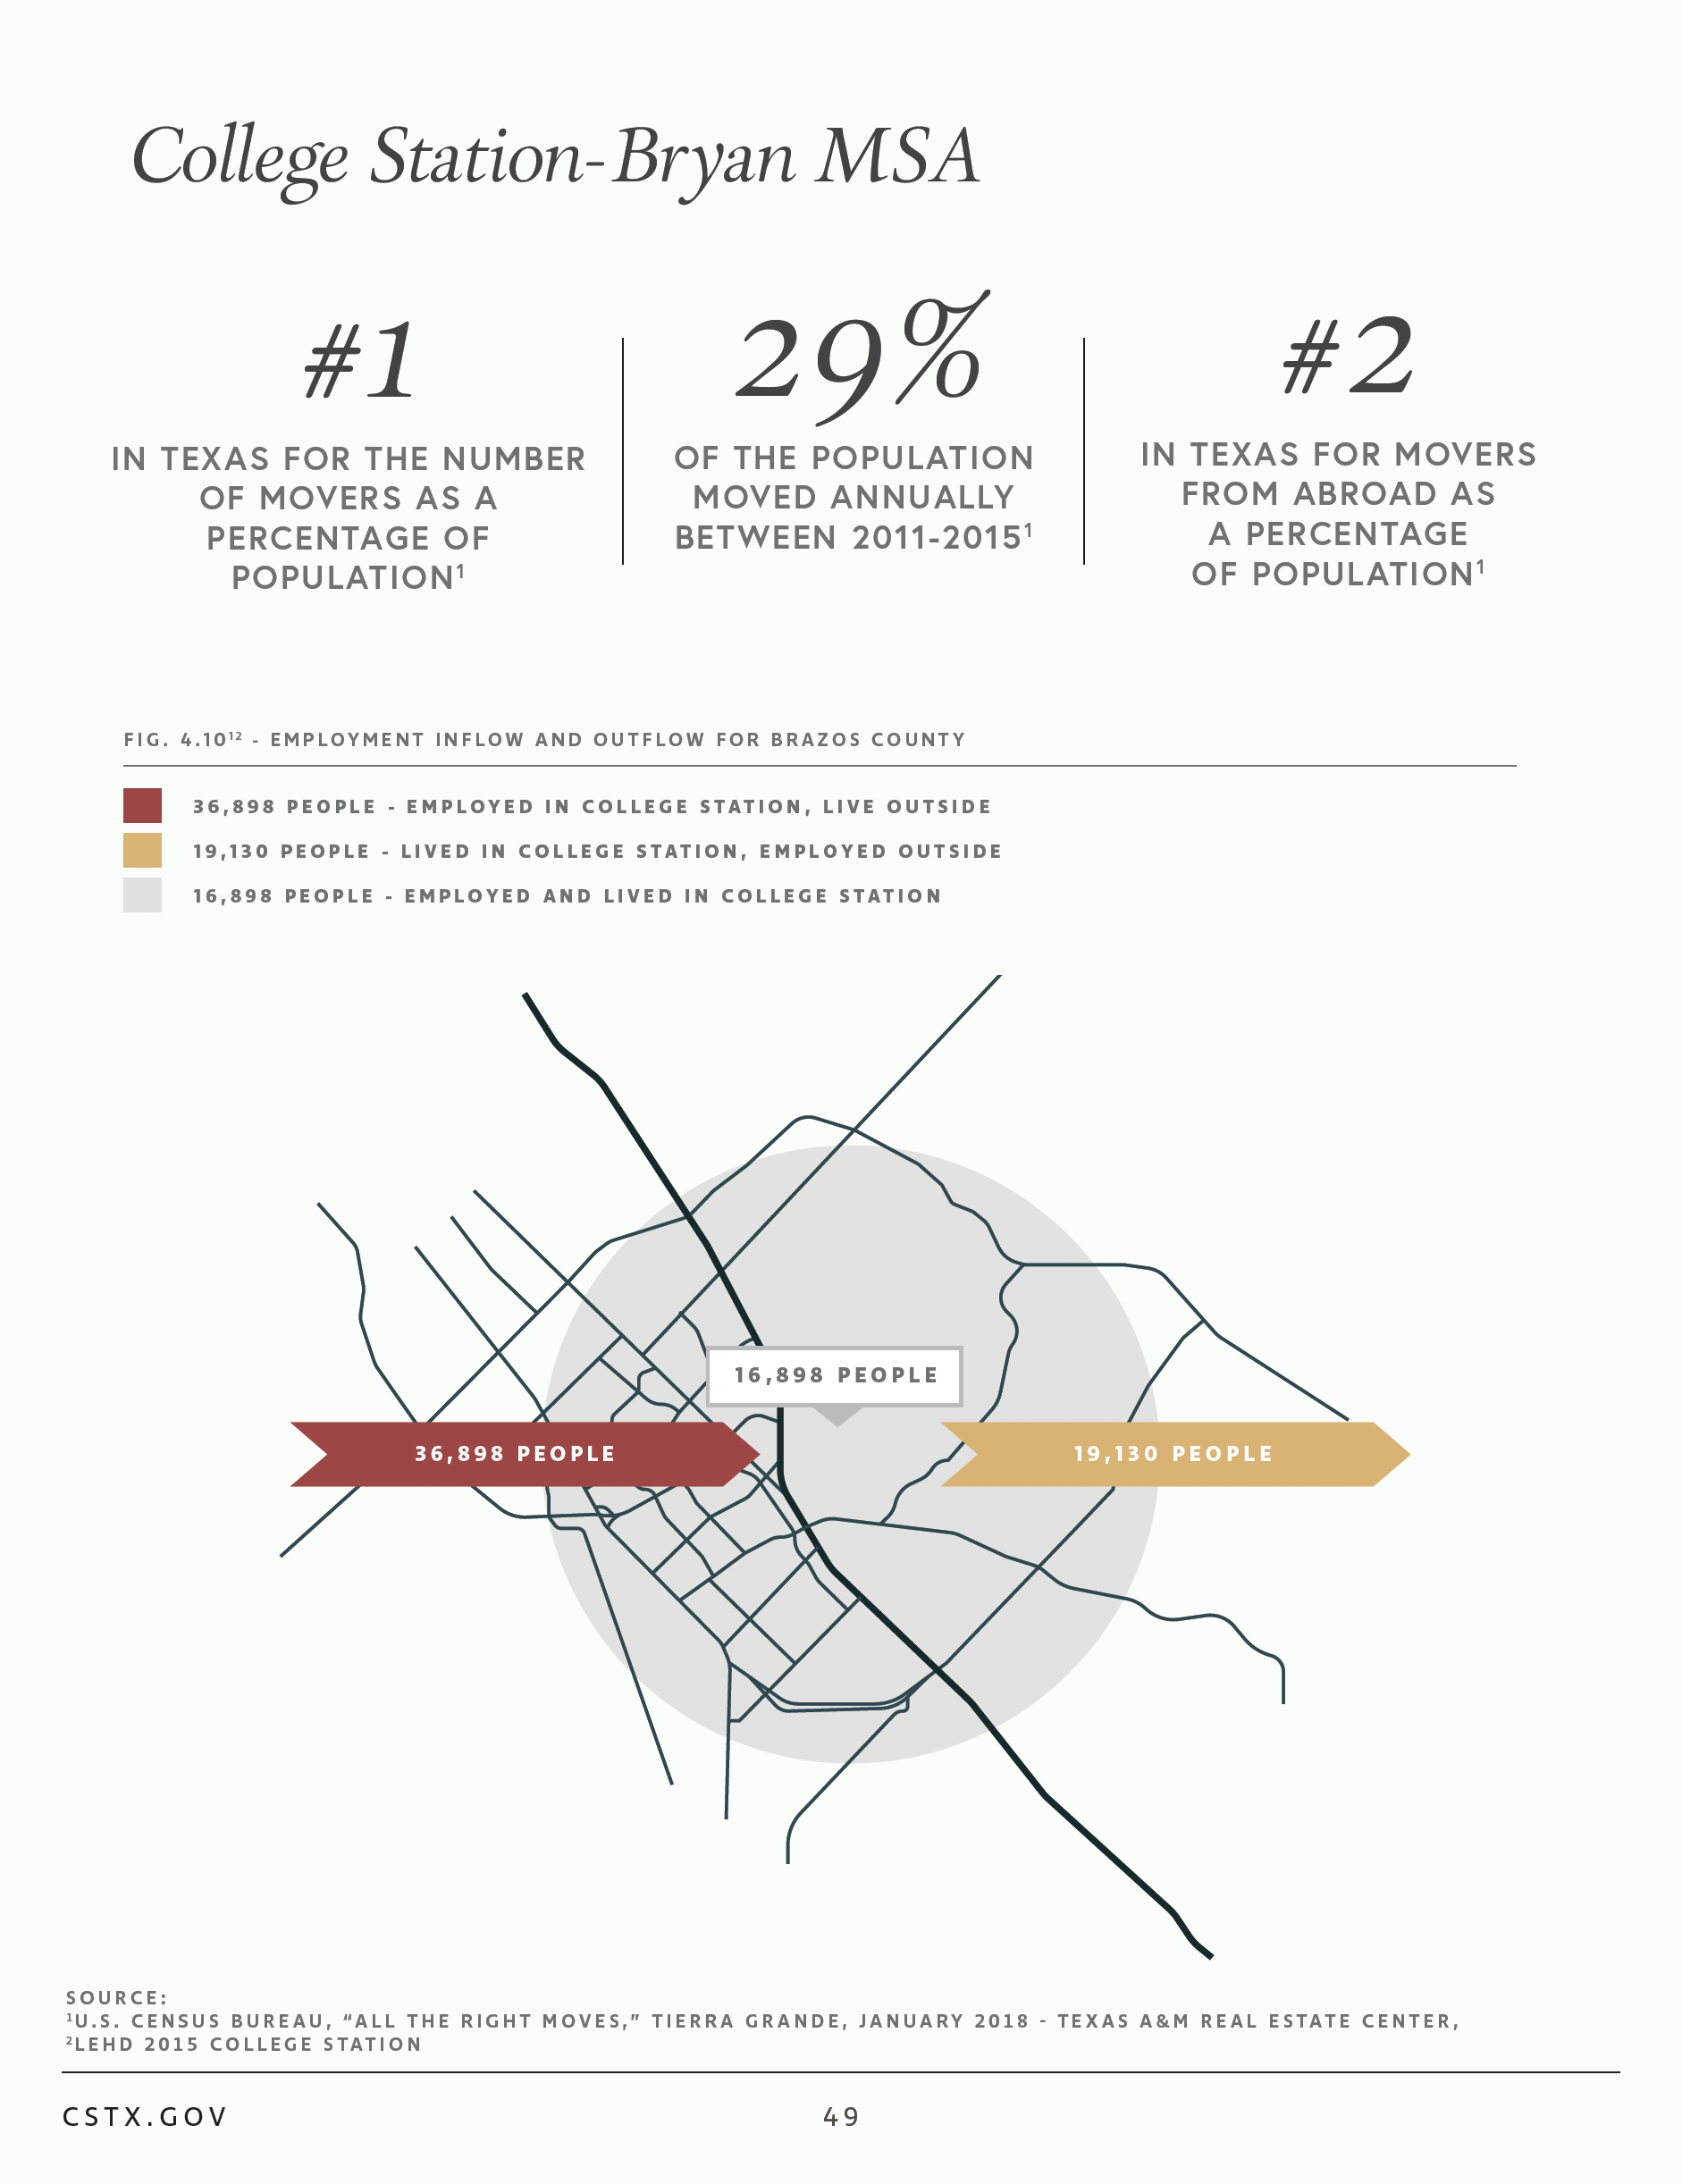
This 27 page document outlines the governed plan for the Economic Development Department over the next 10 years. It’s narrated by graphs, charts and infographics to make the statistics clear and beautiful.


Planning and Development Existing Conditions Report
This 139 page document lays out data so the city can plan for the expected growth over the next 10 years. Aided with photos, maps and graphs, it paints a picture of a vibrant, friendly city.


Tourism Travel Visual
This simple travel visual is a quick and easy breakdown of major attractions for College Station.
